Basemap tiles are slow or unavailable. The story, filters and counts remain readable from the locked data files.
Loading map and data layers…
East Africa's small-mammal record, 1900–2026. Scroll to read — or press play to watch the blackout.
All yearscensus 165,188 dated records
N
J/K chapters · L layers · A ask · M map · Esc close
Open-data story map · ASMS 2027 companion
Thirty Years in the Dark.
Story map by Gerald Shikunyi Kombo
The idea · make thirty years of absence visible
Every dot is a real animal, recorded by a real person.
Kenya, Tanzania and Uganda hold 181,122 open occurrence records for 13 small-mammal taxa — bats, rodents, shrews, sengis, hyraxes, galagos, hares, hedgehogs, mongooses, civets, mustelids, canids and pangolins — published through GBIF.org between 1900 and 2026. [1]
How to read this map: each dot is one occurrence record with coordinates — museum specimen, survey capture or verified observation. Era is encoded twice, by colour and by dot style: pre-1970 — sky blue, plain fill · 1970–1999 — amber, dark rim · 2000 onward — green, soft halo. Press ▶ on the timeline to play the census decade by decade: this is a map of time as much as space, and the blackout is something you watch happen. Use the layers panel (L) for era visibility and opacity, and the taxon chips to highlight one taxon. Ask the atlas (A) for grounded answers.
181,122open records
census, 1900–2026
13small-mammal taxa
KE · TZ · UG
Key terms and units
An occurrence record is one dated, located observation or specimen. A census counts every open record; the dots on this map are an era-balanced sample for display.
Baseline = the open record planners consult. When a baseline stops in 1969, it cannot answer what changed after it.
Counts throughout: records, never estimates. Records ≠ effort is stated wherever it matters.
Chapter 1 · The museum era
Before 1970, the record was surprisingly rich
Museum expeditions and colonial-era surveys produced 49,961 records before 1970 — 27.6% of everything. [1]
For some species, the cabinet specimens of that era still form a large share of what science knows. Remember these numbers — the next chapter breaks them.
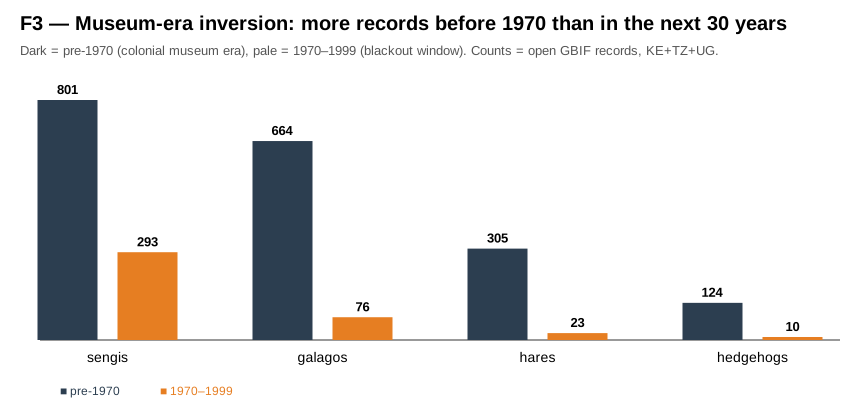
664galago records pre-1970
of 1,742 lifetime
305hare records pre-1970
of 770 lifetime
124hedgehog records pre-1970
of 351 lifetime
11pangolin records pre-1970
of 68 lifetime
Chapter 2 · The blackout
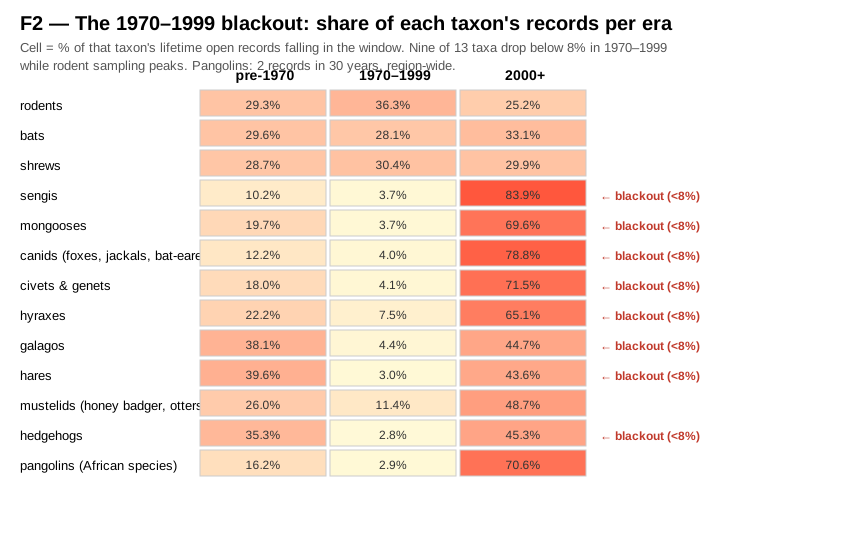
1970–1999: nine of thirteen taxa fall below 8%
While rodent records peaked (34,613 — their largest era share), nine taxa produced almost nothing: sengis 3.7%, hyraxes 7.5%, galagos 4.4%, hares 3.0%, hedgehogs 2.8%, mongooses 3.7%, civets 4.1%, canids 4.0%, pangolins 2.9% of their lifetime totals. [1]
9 / 13taxa below 8%
in the blackout window
34,613rodent records 1970–1999
their largest era
Each cell = % of that taxon's lifetime records in the era. Full census (181,122 records), not the map sample.
Whether the gap reflects sampling collapse or digitization lag, it defines the record conservation planners actually consult. A baseline that stops in 1969 cannot answer what changed after it.
Chapter 3 · The pangolin spotlight
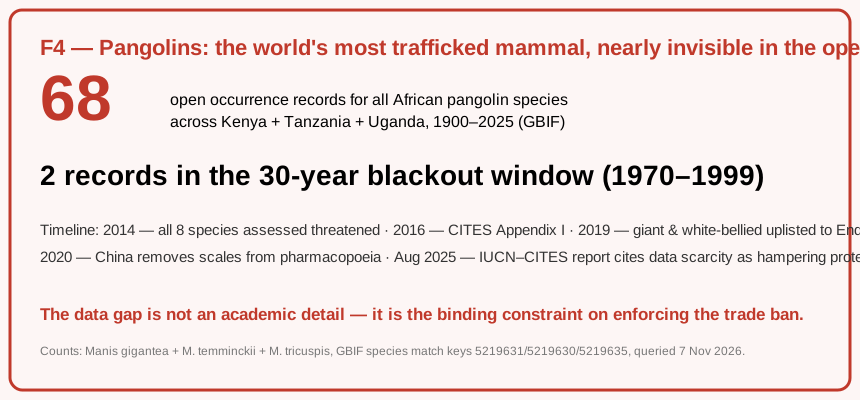
68 records for the world's most trafficked mammal
All eight pangolin species are threatened globally; all have been on CITES Appendix I since 2016. Yet across Kenya, Tanzania and Uganda the open record holds just 68 records — from three species (giant, Temminck's ground, white-bellied) — and only two date from 1970–1999. [3]
Of the 68, 57 carry coordinates: every one of them is on your map now. That is the whole georeferenced census.
68open records, region-wide
3 species · 1900–2026
2records in the blackout
1970–1999
Timeline: 2014 all eight species threatened · 2016 CITES Appendix I · 2019 giant & white-bellied uplisted to Endangered · 2020 China removes scales from its pharmacopoeia · 2025 IUCN–CITES report cites data scarcity as hampering protection.
A 2025 IUCN–CITES report cites exactly this data scarcity as a barrier to protecting pangolins. [3] The atlas makes the scarcity countable: 68.
Chapter 4 · The rebound
Sengis prove the dark is reversible
Sengis (elephant-shrews) nearly stopped being recorded in 1970–1999 (293 records, 3.7%). Then attention returned: 84% of all sengi records are post-2000 (6,583 of 7,846). [1]
Dedicated surveys, camera traps and taxonomy projects can rebuild a baseline within a generation.
84%of sengi records post-2000
6,583 of 7,846
293sengi records 1970–1999
3.7% of lifetime
The museum-era inversion: dark bars (pre-1970) tower over orange bars (1970–1999) for four of the nine blackout taxa.
Close · What the atlas is for
Adopt a gap
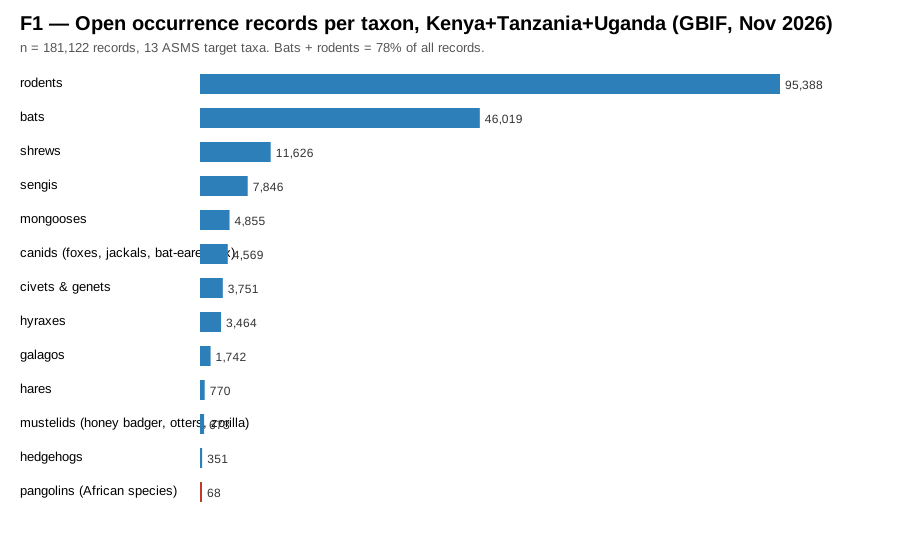
Bats and rodents — the key zoonotic-reservoir and pest taxa for One Health and food security — hold 78% of all records. The other eleven taxa share 22%. That imbalance shapes what gets studied, what gets protected, and what gets funded. [1]
Lifetime open records per taxon, 1900–2026, KE+TZ+UG.
The analysis pipeline (GBIF queries → locked JSON → these figures) is reproducible in one command and will be deposited with a citable DOI. The invitation to researchers, museums and surveys across the three countries: adopt a gap — pick a taxon-era cell in the heat map and fill it.
Companion to the ASMS 2027 abstract · “Thirty Years in the Dark: 181,122 Open Records Reveal a Baseline Blackout for East Africa's Small Mammals” · 15th African Small Mammal Symposium, Diani, Kenya, 14–18 June 2027.
Sources & attribution
[1] Full census counts (every number in the stat cards and figures): GBIF.org Occurrence Search API v1, queried 7 November 2026 — taxon_key × country=KE,TZ,UG × era windows (1900–1969 / 1970–1999 / 2000–2026), raw count field, no modelling. Locked copy: data/stats.json (13 taxa + grand totals, 181,122).
[2] Map points: GBIF.org occurrence records with coordinates, fetched 8–9 November 2026, era-balanced sample (≤1,000 per era per taxon; rare taxa complete — 21,436 points). Locked copy: data/points.json. Samples are for display only — census numbers govern every claim.
[3] Pangolin threat & trade facts: IUCN Red List December 2019 assessment update (all eight species threatened; giant and white-bellied uplisted to Endangered); CITES CoP17 (2016, Appendix I); IUCN–CITES, Conservation Status, Trade and Enforcement Efforts for Pangolins (August 2025).
[4] Pangolin taxonomy note: GBIF indexes the region's pangolins under Manis species keys 5219631 (giant), 5219630 (Temminck's), 5219635 (white-bellied); M. tetradactyla has 0 records in KE/TZ/UG — a true zero (West/Central African species).
[5] Field notes (hover cards & taxon chips): facts paraphrased from a privately compiled East African conservation records corpus (95 source documents, 5,248 pages, 1963–2020), digitized independently by the author. Facts only — no source text is republished; each note carries its source document's year. Locked copy: data/corpus-notes.json. These notes are educational context, never census: every count on this page comes from [1] and [2].
Data authorities. Occurrence data: GBIF.org and the hundreds of museums, surveys and observers who published it. Occurrence records may carry GBIF-mandated licences (CC0/CC-BY/CC-BY-NC) of their own; the census queries aggregate counts only. Threat facts: IUCN Red List and IUCN–CITES.
Field notes: data/corpus-notes.json · paraphrased facts, source [5]
Figures: figures/F1–F4.svg · generated from the census
Field notes from the 1963–2020 records corpus (hover any taxon chip to see these in place)
Loading locked field notes…
Figure & timeline data as tables (screen-reader and print friendly)
Methodology
Records ≠ effort. GBIF counts measure digitized, published occurrences. Era gaps may reflect less fieldwork, less digitization of that era's collections, or both — under either reading the open record that planners consult has a thirty-year hole. This map asserts no cause. Locked data. Both JSON files are frozen snapshots (timestamps inside); nothing on this page queries a live API. Honest sampling. The map never displays more points than were fetched, and the sample label travels with it. Countries are pooled in the census; per-point country codes are sample-only. Mapped points may cluster at institutional or survey centroids; a dot's position carries the precision its publisher reported. Undated records. 15,934 records (8.8%) carry no year; the era windows cover the dated remainder, and every era share on this page is computed against the full census, never the dated subset. Georeference honesty. 466 sample points (2.2%) fall outside the three-country bounding box — publisher coordinate errors; they remain in the locked file and in this count, but are excluded from map display and from the drawn-point counter.
Scientific, cartographic, and technical standards
Data integrity: every displayed figure comes from the locked census file, validated at page start against the published totals (a mismatch raises a visible banner — the page never silently disagrees with its source); the pipeline (gbif_research.js, fetch_points.js, make_figures.js — Node 18+, no dependencies) is re-runnable and will be deposited with a citable DOI (GBIF download DOI + Zenodo) before June 2027.
Perceptual cartography: Okabe-Ito colour-blind-safe era palette (#56B4E9 / #E69F00 / #009E73) with a redundant non-colour encoding (plain fill / dark rim / soft halo), metric scale bar, north arrow, and a synchronized era-and-taxon legend.
Universal access: responsive scrollytelling layout, cooperative two-finger map gestures so one finger scrolls the story, keyboard shortcuts (J/K/L/A/M/Esc, Ctrl+K search), visible focus states, screen-reader announcements, reduced-motion support, a clean print view, and a tap or focus equivalent for every hover interaction.
Open science & transparency: the census is downloadable as CSV and the map sample as GeoJSON, both generated in your browser from the same locked files the page reads, under a Creative Commons Attribution 4.0 International licence (CC-BY 4.0). Every figure carries its exact values as a sortable, screen-reader-accessible HTML table. The ask assistant runs server-side on a free model allowance — no API key in the browser, no stored questions, no analytics — and answers in English, French or Kiswahili.
Data last checked: 2026-11-09, a full re-run of the census pipeline (counts byte-identical) and a re-fetch of the map sample. Corrections: kombo@tutanota.de — or re-run the pipeline yourself; every number is one command away.
Basemaps & technology: Vector tiles: OpenFreeMap Liberty (OpenMapTiles, OpenStreetMap contributors). Satellite imagery: Esri World Imagery (Esri, Maxar, Earthstar Geographics, and the GIS User Community). Map rendering: MapLibre GL JS (BSD 3-Clause). Palette: Okabe-Ito Color Universal Design (Okabe & Ito 2008). Projection: Web Mercator (EPSG:3857). Cartography and narrative: Gerald Shikunyi Kombo (2026). Built on open data published through GBIF.org.
Privacy: this page sets no cookies and runs no analytics. The ask assistant sends your question to a server-side endpoint that forwards it to a hosted model and returns an answer; questions are not logged or stored. “Locate me” uses your browser's own permission prompt and the position stays on your device.
Cite this work
Kombo, G. S. (2026). Thirty Years in the Dark: The Blackout Atlas — East Africa's Small Mammals, 1900–2026 [Interactive story map]. Data: GBIF.org. https://small-mammal-register.pages.dev/
Open data, licensed CC-BY 4.0. Story map & analysis: Gerald Shikunyi Kombo. Occurrence data: GBIF.org and the hundreds of institutions and observers who published it.
Dot colour & style: era
pre-1970 · plain1970–1999 · rim2000+ · halo
Okabe-Ito colour-blind-safe palette, plus a non-colour dot style per era. Each dot is one sampled occurrence record; census totals govern every claim (stat cards and figures).
Chips highlight the sampled dots of the chosen taxa and dim the rest; they never remove context entirely. Census counts per taxon: see the figures and the downloadable CSV.